Flow metrics: forecast with data instead of story points
How long does work take? How much gets done? When will it be finished? Six short explainers, the full course underneath them, and the reading that goes with it.
Flow metrics are the measurements you get for free from work that's already happening. Things start. Things finish. Measure how long that took (cycle time) and how many finished (throughput), and you can answer the questions that story points and velocity never really could: how long will this take, how much can we get done by then, and is this project in trouble yet? No estimating meetings required, and when someone asks for a date you can give them a forecast with a probability on it instead of a promise.
Start with the six short videos. If you want the whole argument, with the demos, the 2023 course below goes through it end to end.
Start here: Flow Metrics Explained
Six videos from January 2026, two to five minutes each, with a companion post for every one. Also a playlist on YouTube.
 2:31
2:31
1. What is Cycle Time?
January 23, 2026
Cycle time is how long stuff takes. Simple concept, but the start and end points really matter. Get them wrong and your metrics are meaningless.
 3:00
3:00
2. What is Throughput?
January 23, 2026
Forget story points. Forget velocity. There's an easier way to predict the future: just count what you finish. Throughput is the simplest flow metric and the foundation for everything else.
 4:54
4:54
3. Why Size Doesn't Matter
January 23, 2026
"But our items aren't all the same size!" I know. It doesn't matter. And here's the uncomfortable truth: your story points aren't working either.
 2:04
2:04
4. When Will It Be Done? Monte Carlo Forecasting Explained
January 23, 2026
"When will it be done?" sounds like a simple question. It's not. You're never really predicting one item, you're predicting a pile, and that changes everything.
 3:17
3:17
5. Cycle Time Targets: Spotting Trouble Before It's Too Late
January 23, 2026
What does "in trouble" actually mean? It's subjective, unless you have data. Cycle time targets let you define what "typical" looks like so you can spot problems before they blow up.
 1:16
1:16
6. "We Need Exact Dates": How to Handle This Conversation
January 23, 2026
"Just give me a date. I don't want probabilities." Sound familiar? Here's the thing: you've been giving exact dates for years. How's that working out?
The full course
Predicting the Future, Estimating, and Running Your Projects with Flow Metrics (October 2023). Twenty-one videos, about two hours in all, from why estimation is hard through throughput forecasting, cycle time and work in progress, to running a project with cycle time targets and aging work. These are on YouTube only; there isn't a written version. Watch them in order here or as the playlist.
Overview
 1:47
1:47
1. Course Overview
Little's Law, work in progress, cycle time and throughput: what the course covers and why no estimating is required.
Traditional estimation: how we got here
 5:22
5:22
2. The Difficulty of Estimation
 5:19
5:19
3. Traditional Agile Estimation Techniques
 6:33
6:33
4. Story Point Estimation Stinks
Throughput
 7:22
7:22
5. Introduction to Throughput
 6:33
6:33
6. What's So Bad About Story Points & Velocity?
 5:38
5:38
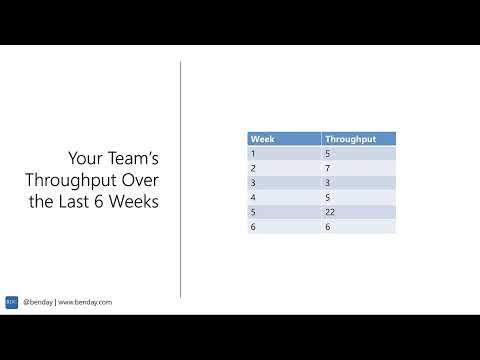
7. Forecasting with Throughput and Monte Carlo Simulations
 8:15
8:15
8. Demo: Forecast Delivery of a Feature using Throughput and Monte Carlo
 2:04
2:04
9. Demo: Use a Tool to Forecast Delivery of a Feature
 9:35
9:35
10. Demo: Forecast How Much Can Be Delivered by a Date using Throughput and Monte Carlo
 3:10
3:10
11. Demo: Use a Tool to Forecast Delivery by Date
Cycle time, work in progress, and feedback
 2:38
2:38
12. Cycle Time & Work In Progress (WIP)
 5:08
5:08
13. What's Cycle Time Have to Do with Feedback?
 3:56
3:56
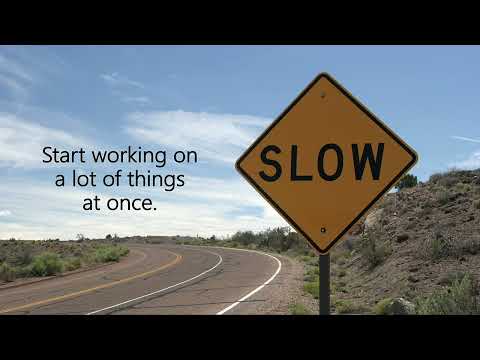
14. Want a Faster Cycle Time? Decrease Your Work In Progress
 5:46
5:46
15. Flow Efficiency & Multitasking
Running and monitoring your projects: SLEs, cycle time targets, and aging work
 0:42
0:42
16. Introduction to Running & Monitoring Your Projects
 7:26
7:26
17. How to Eat an Apple / Why Break Your Work Into Chunks?
 2:51
2:51
18. Cycle Time Targets & Service Level Expectations (SLEs)
 2:48
2:48
19. Determining Your Team's Cycle Time Target
 5:16
5:16
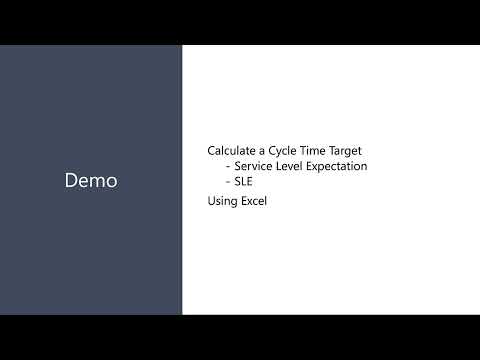
20. Demo: Calculating Your Team's Cycle Time Target
 7:25
7:25
21. Aging Work: Monitor Your Project & Manage Your Risk
Related reading
- Understanding Confidence Levels (50%, 80%, 90%, 99%): Monte Carlo Forecasting, the seventh video in the Flow Metrics Explained playlist: what the percentage on a forecast actually means.
- How to Predict the Future With Azure DevOps & Flow Metrics
- azdoutil's Flow Metric & Project Forecasting Tools Now Support Multiple Teams
- Words for Leaders: Stop Saying "Commitment" When You Mean "Forecast"
- Dev Team Economics #3: The Math Behind the WIP Trap
- Story Point Estimation in Scrum: Some Thoughts, Advice, and a Bit of How-To, from 2014, for the estimating you're still being asked to do in the meantime.
Getting these numbers without a spreadsheet
On GitHub
These metrics, automatically, for teams on GitHub. Honest Cheetah reads your GitHub Projects board and gives you cycle time, throughput and Monte Carlo forecasts for the backlog you already have.
On Azure DevOps
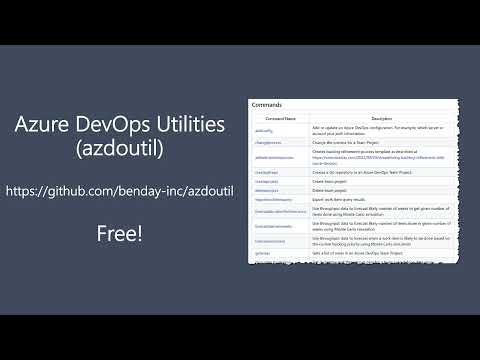
azdoutil is my free, open-source command-line tool for Azure DevOps. It pulls cycle time, throughput and aging work from your team projects and runs the Monte Carlo forecasts from the course.
For leaders
The numbers are the easy part. Using a forecast with stakeholders who want a date is the hard part. The Delivery Intelligence workshop is a half day on exactly that, for your leadership team.
Questions about any of this? Contact me.