
Your Azure DevOps history already knows when it'll be done.
The free Honest Cheetah extension reads your work item history and tells you how long work really takes, how much really gets finished, and when the backlog will likely be done. Right under Boards. No estimates, no process changes, no cost.
Get it free on the Marketplace How to installInstall it into your organization, open a project, and click Honest Cheetah under Boards. Pick a team, or look at all of them. Everything is computed from the history your team already creates when work items change state.
The dashboard
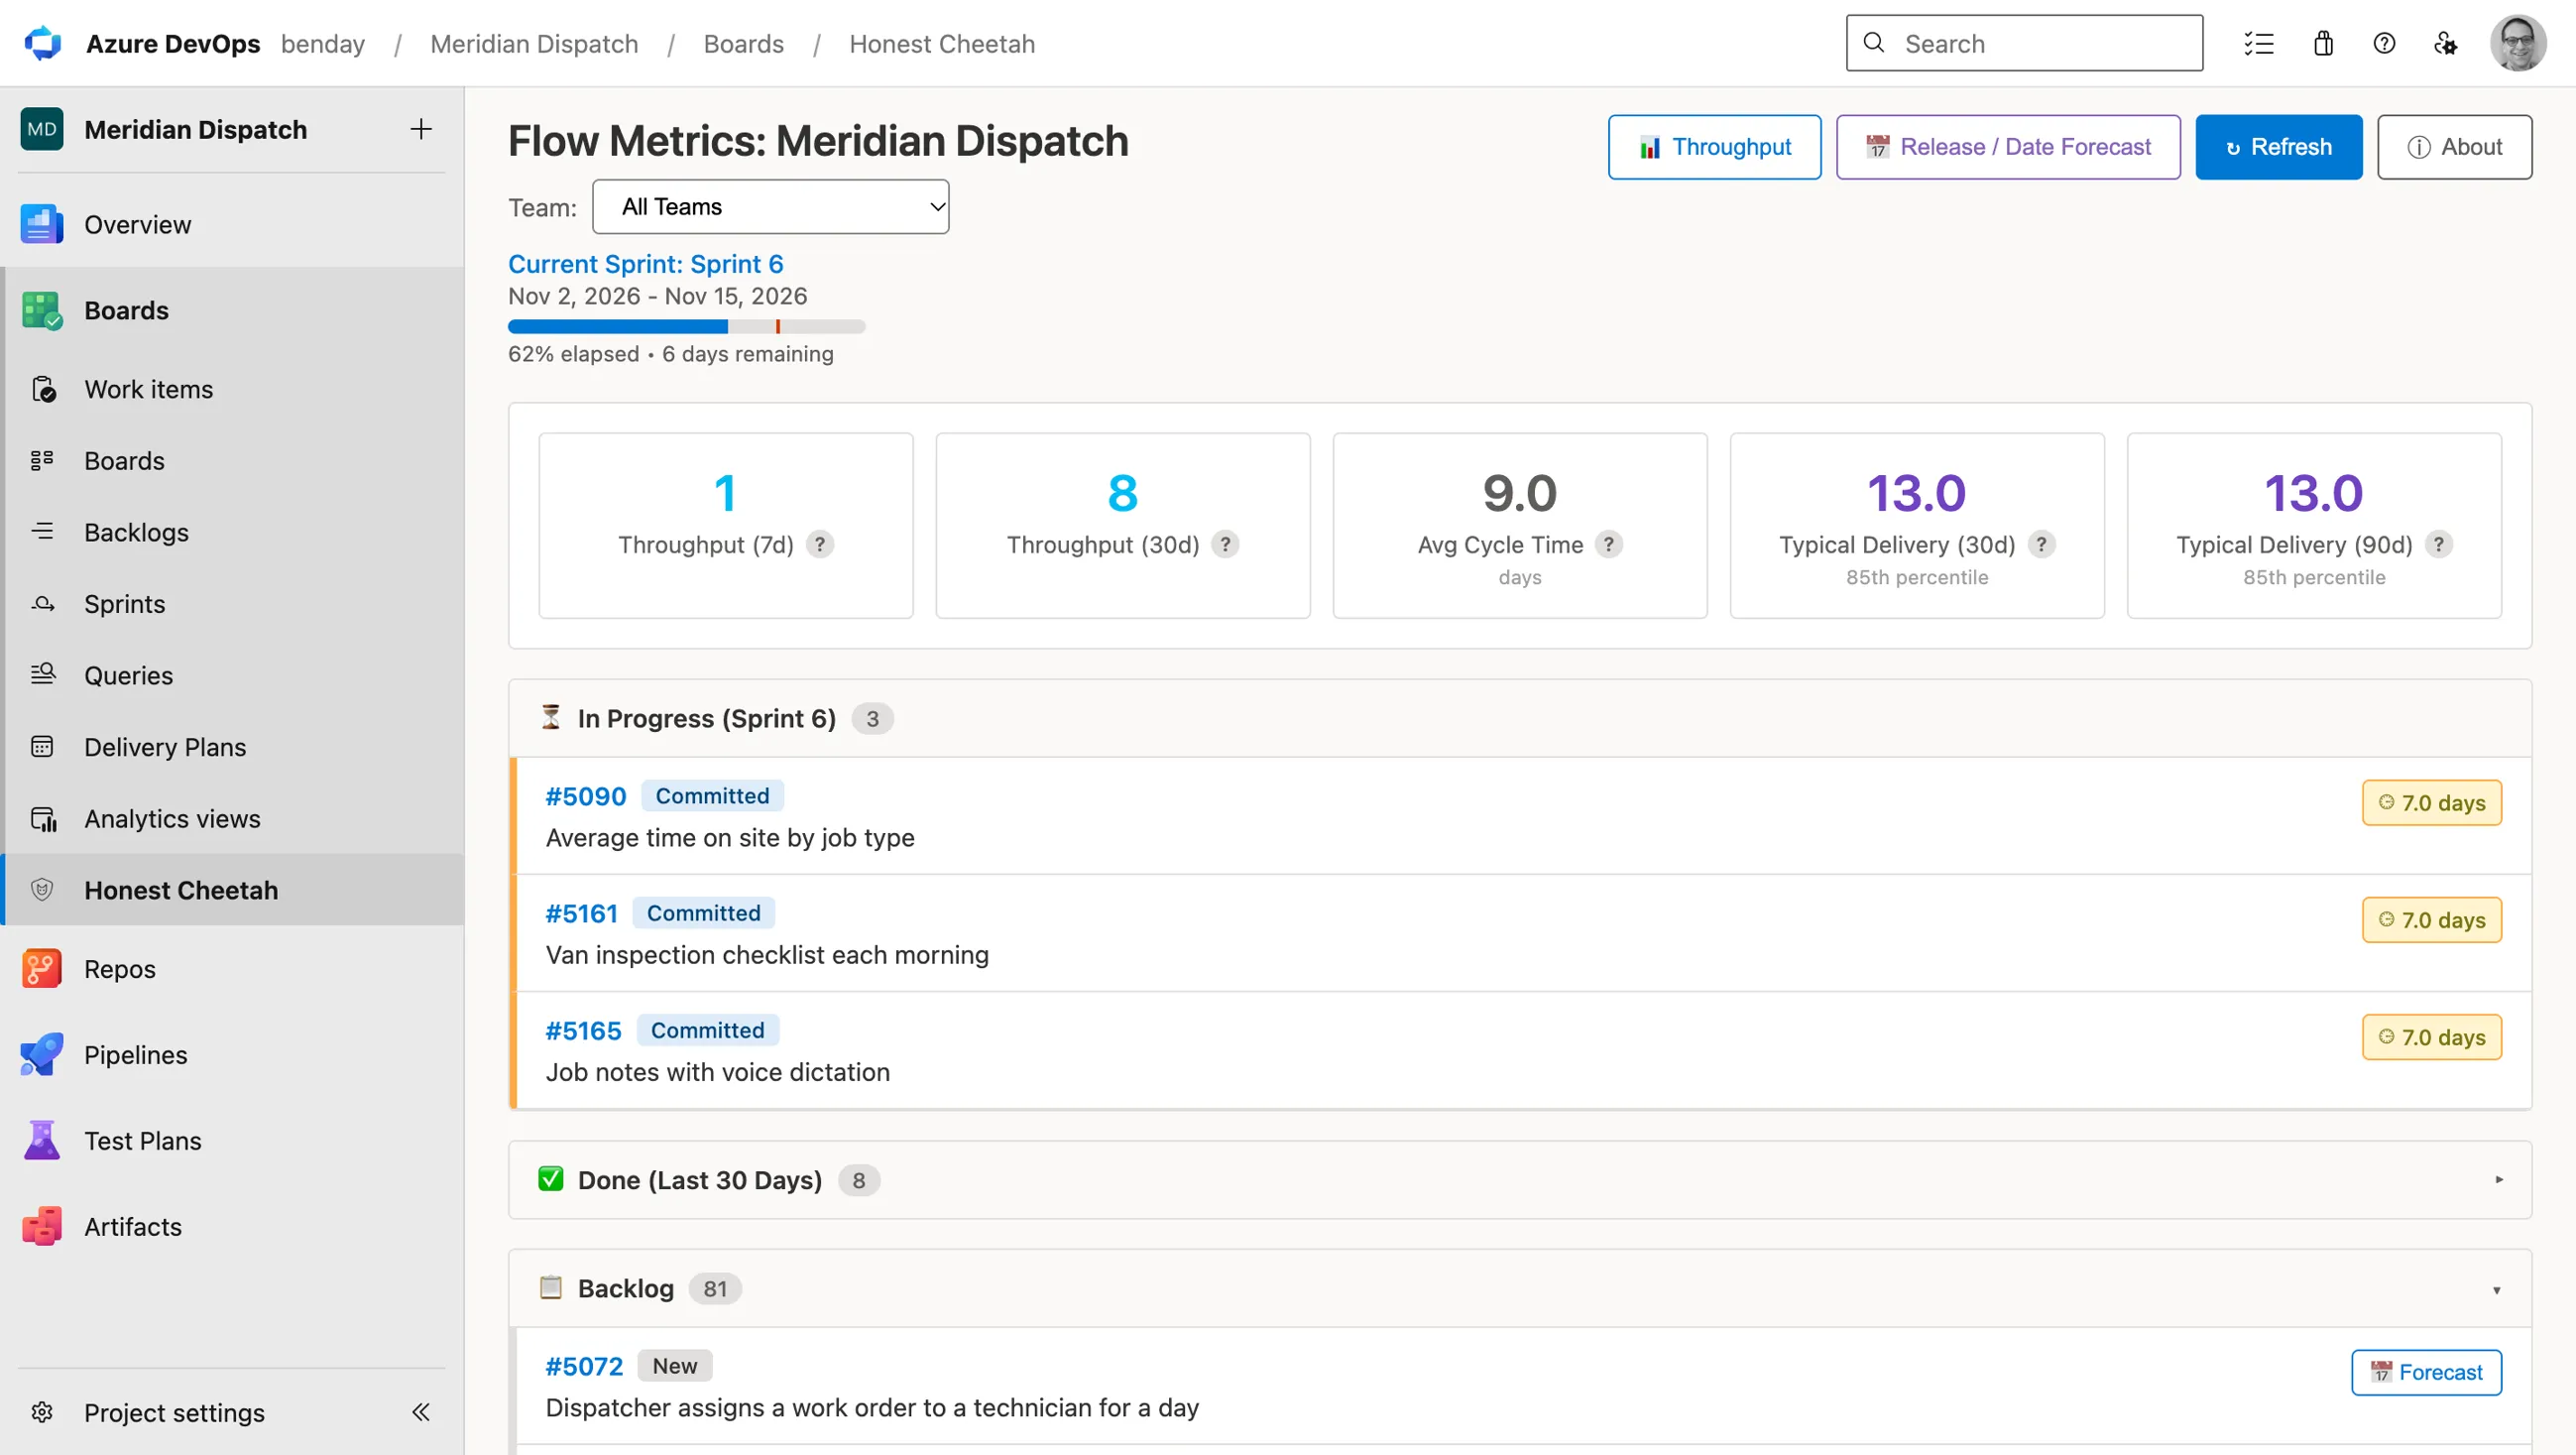
Five numbers across the top: throughput for the last 7 and 30 days, average cycle time, and your typical delivery time over 30 and 90 days, at the 85th percentile. Above them, the current sprint and how much of it has elapsed.
Below them, what's in progress in the current sprint, each item with how long it's been in progress, so the stuck ones show up before somebody asks about them in a meeting. Then what got done in the last 30 days, and the backlog in order with a Forecast button on every item.
How much does the team actually finish?
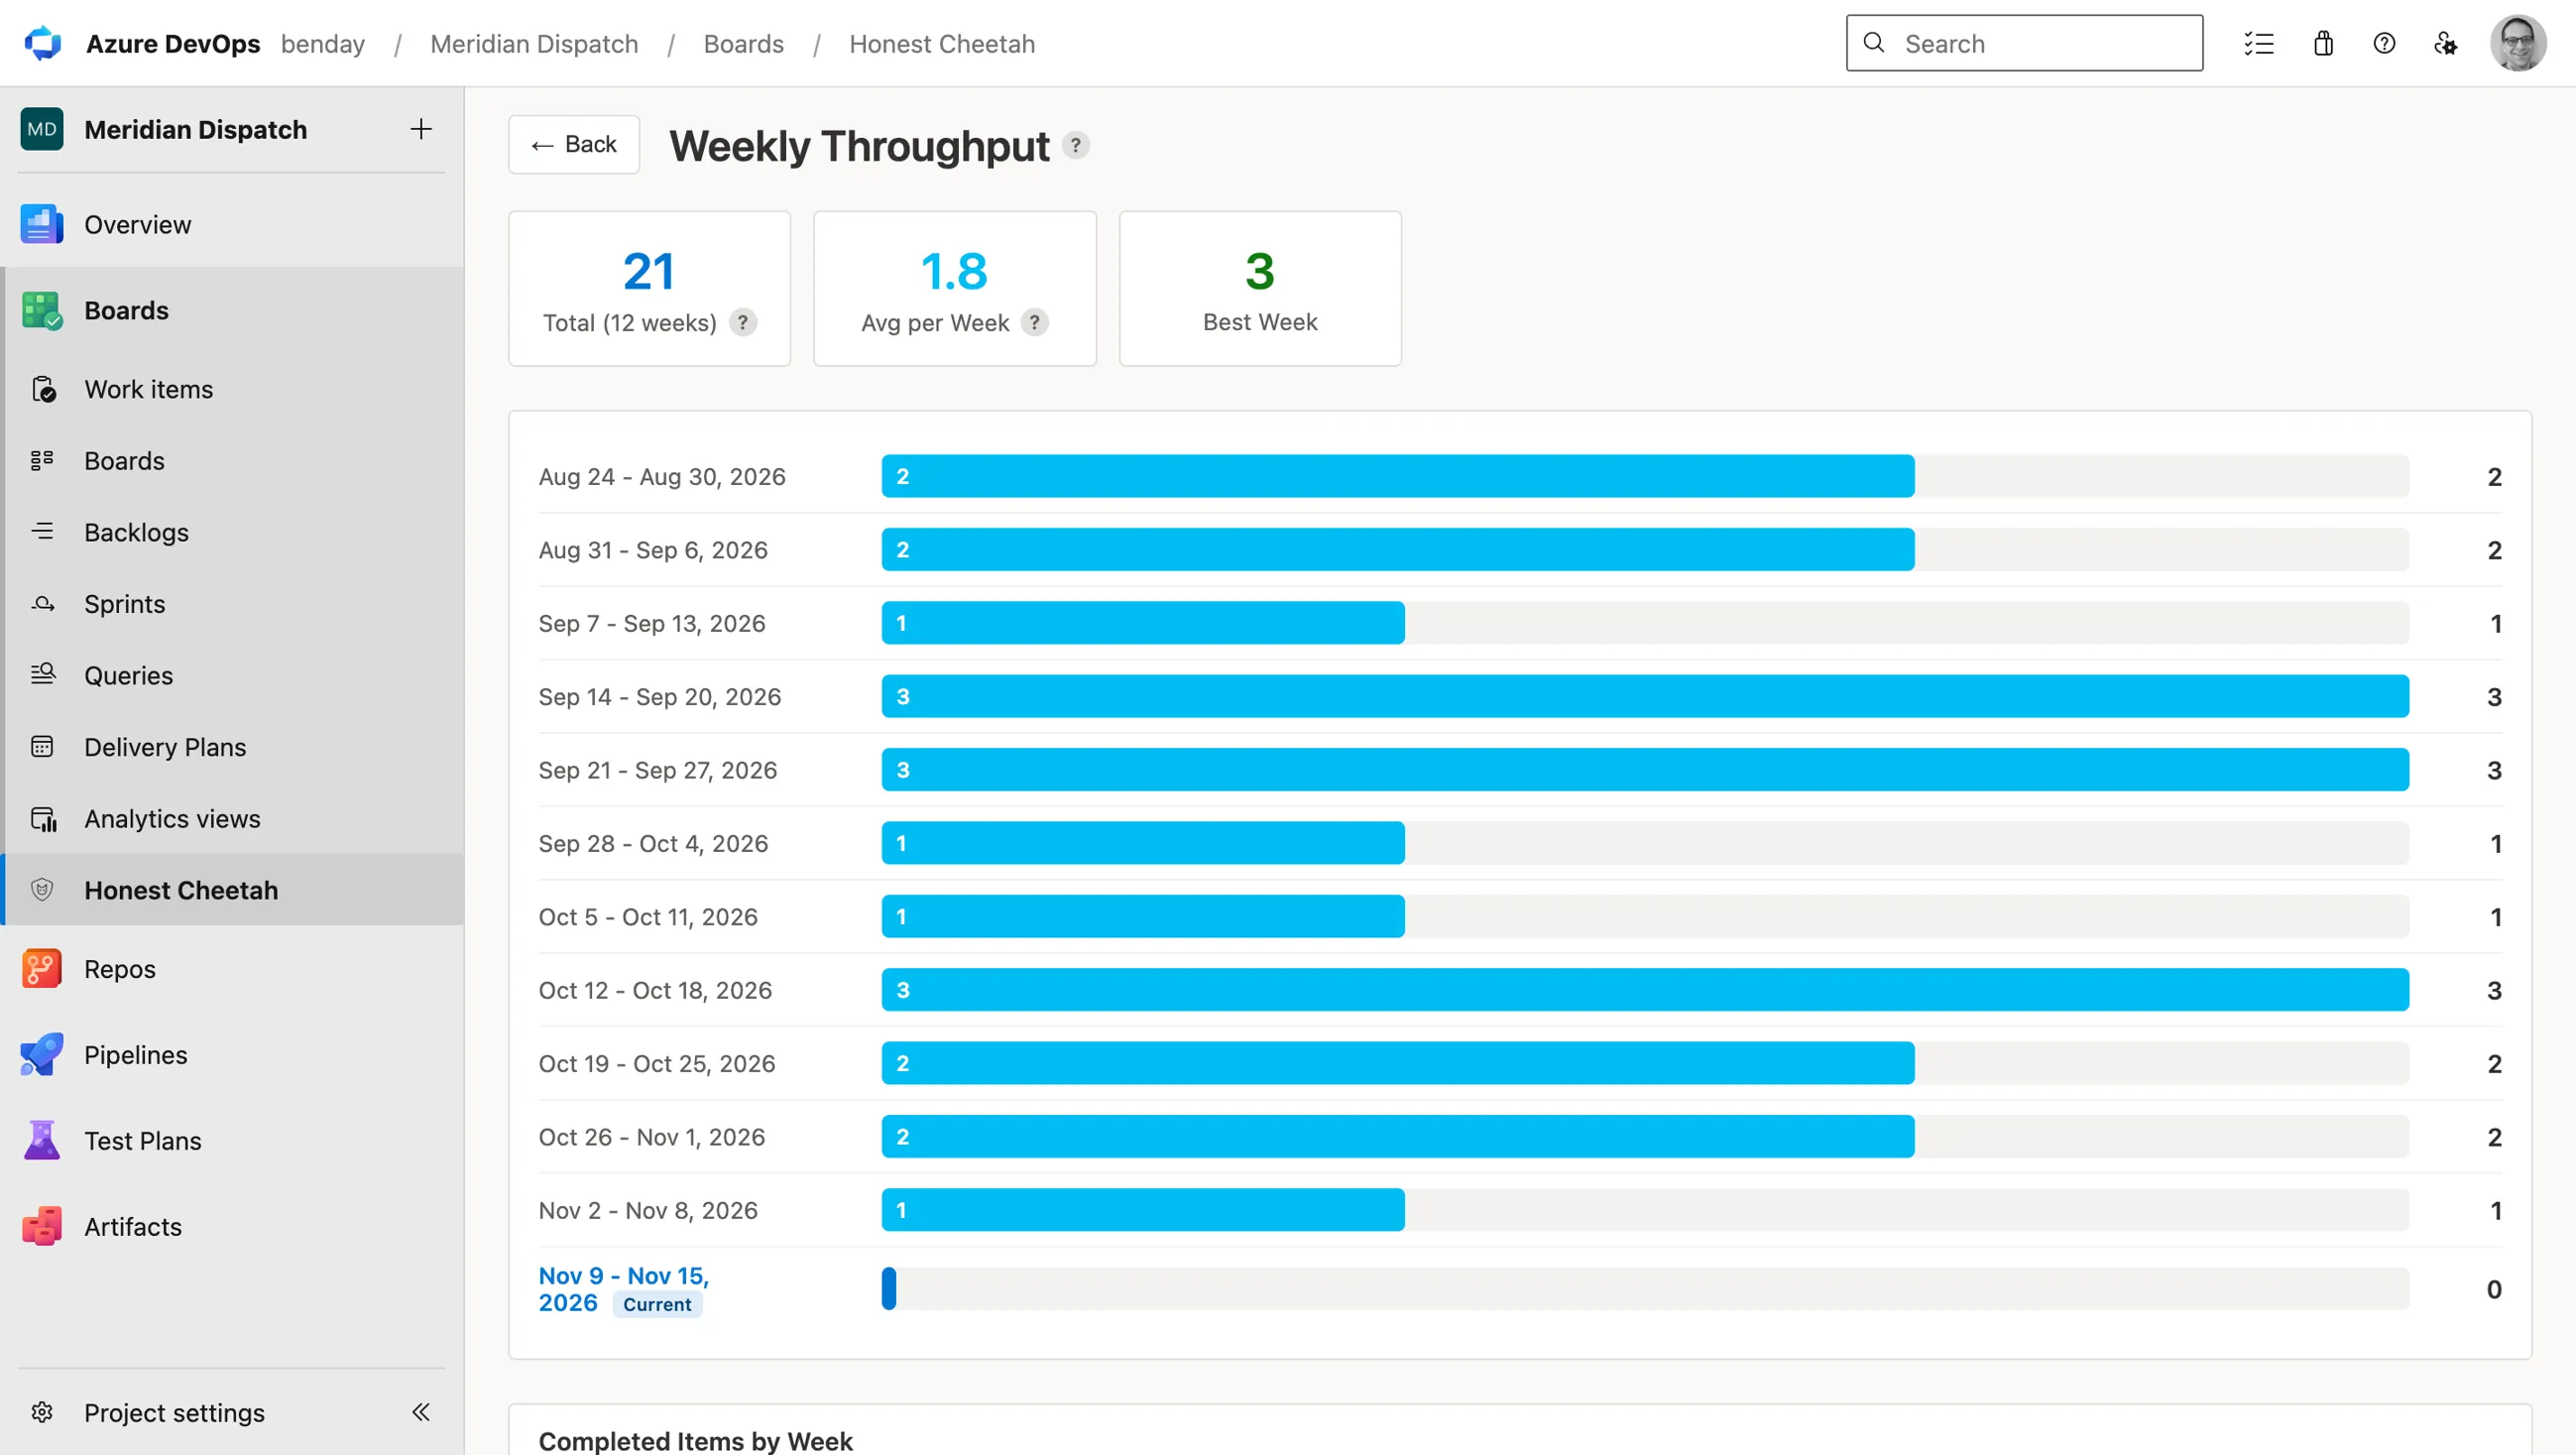
Throughput shows completed items per week for the last 12 weeks, the total, the average and the best week, and which items finished in each week. It's the number every forecast is built on, and it's usually not the number people guess.
"How much will be done by this date?"
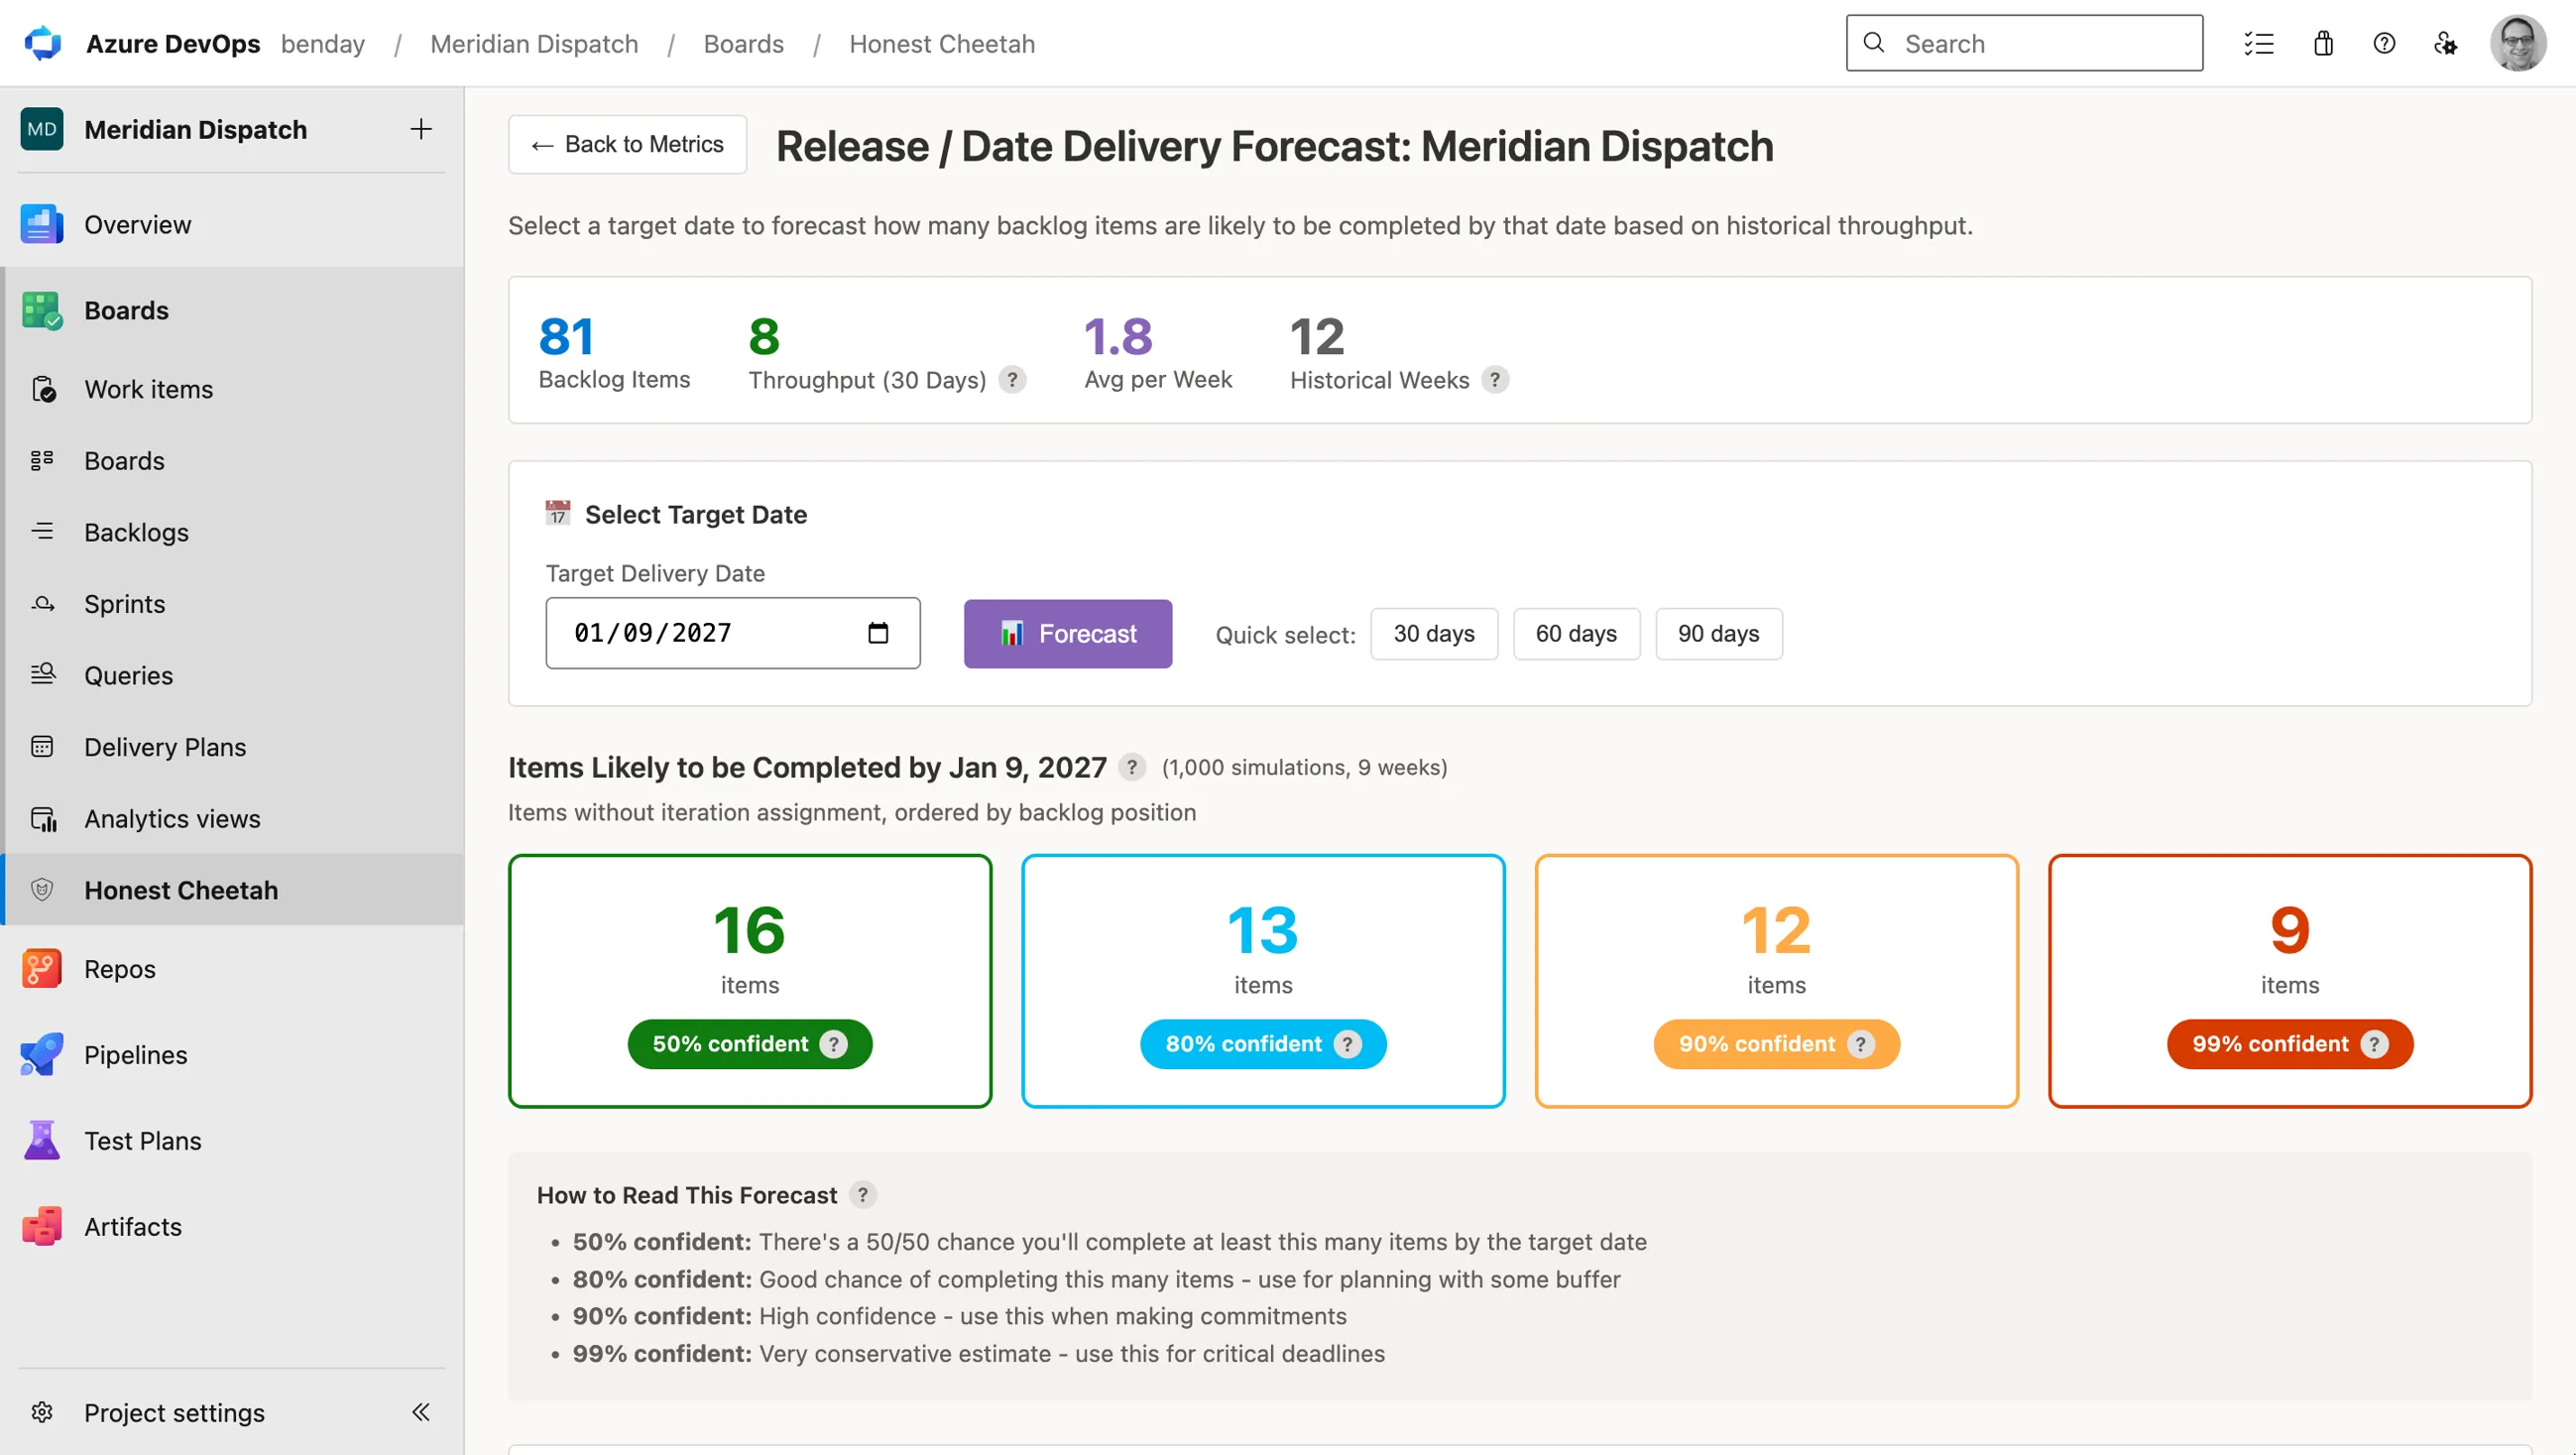
Release / Date Forecast takes a target date and runs a Monte Carlo simulation over your throughput: how many backlog items will likely be finished by then, at 50, 80, 90 and 99 percent confidence, with the backlog listed underneath. Use 50 percent for a coin flip, 80 for planning, 90 when you're making a commitment.
"When will this one be done?"
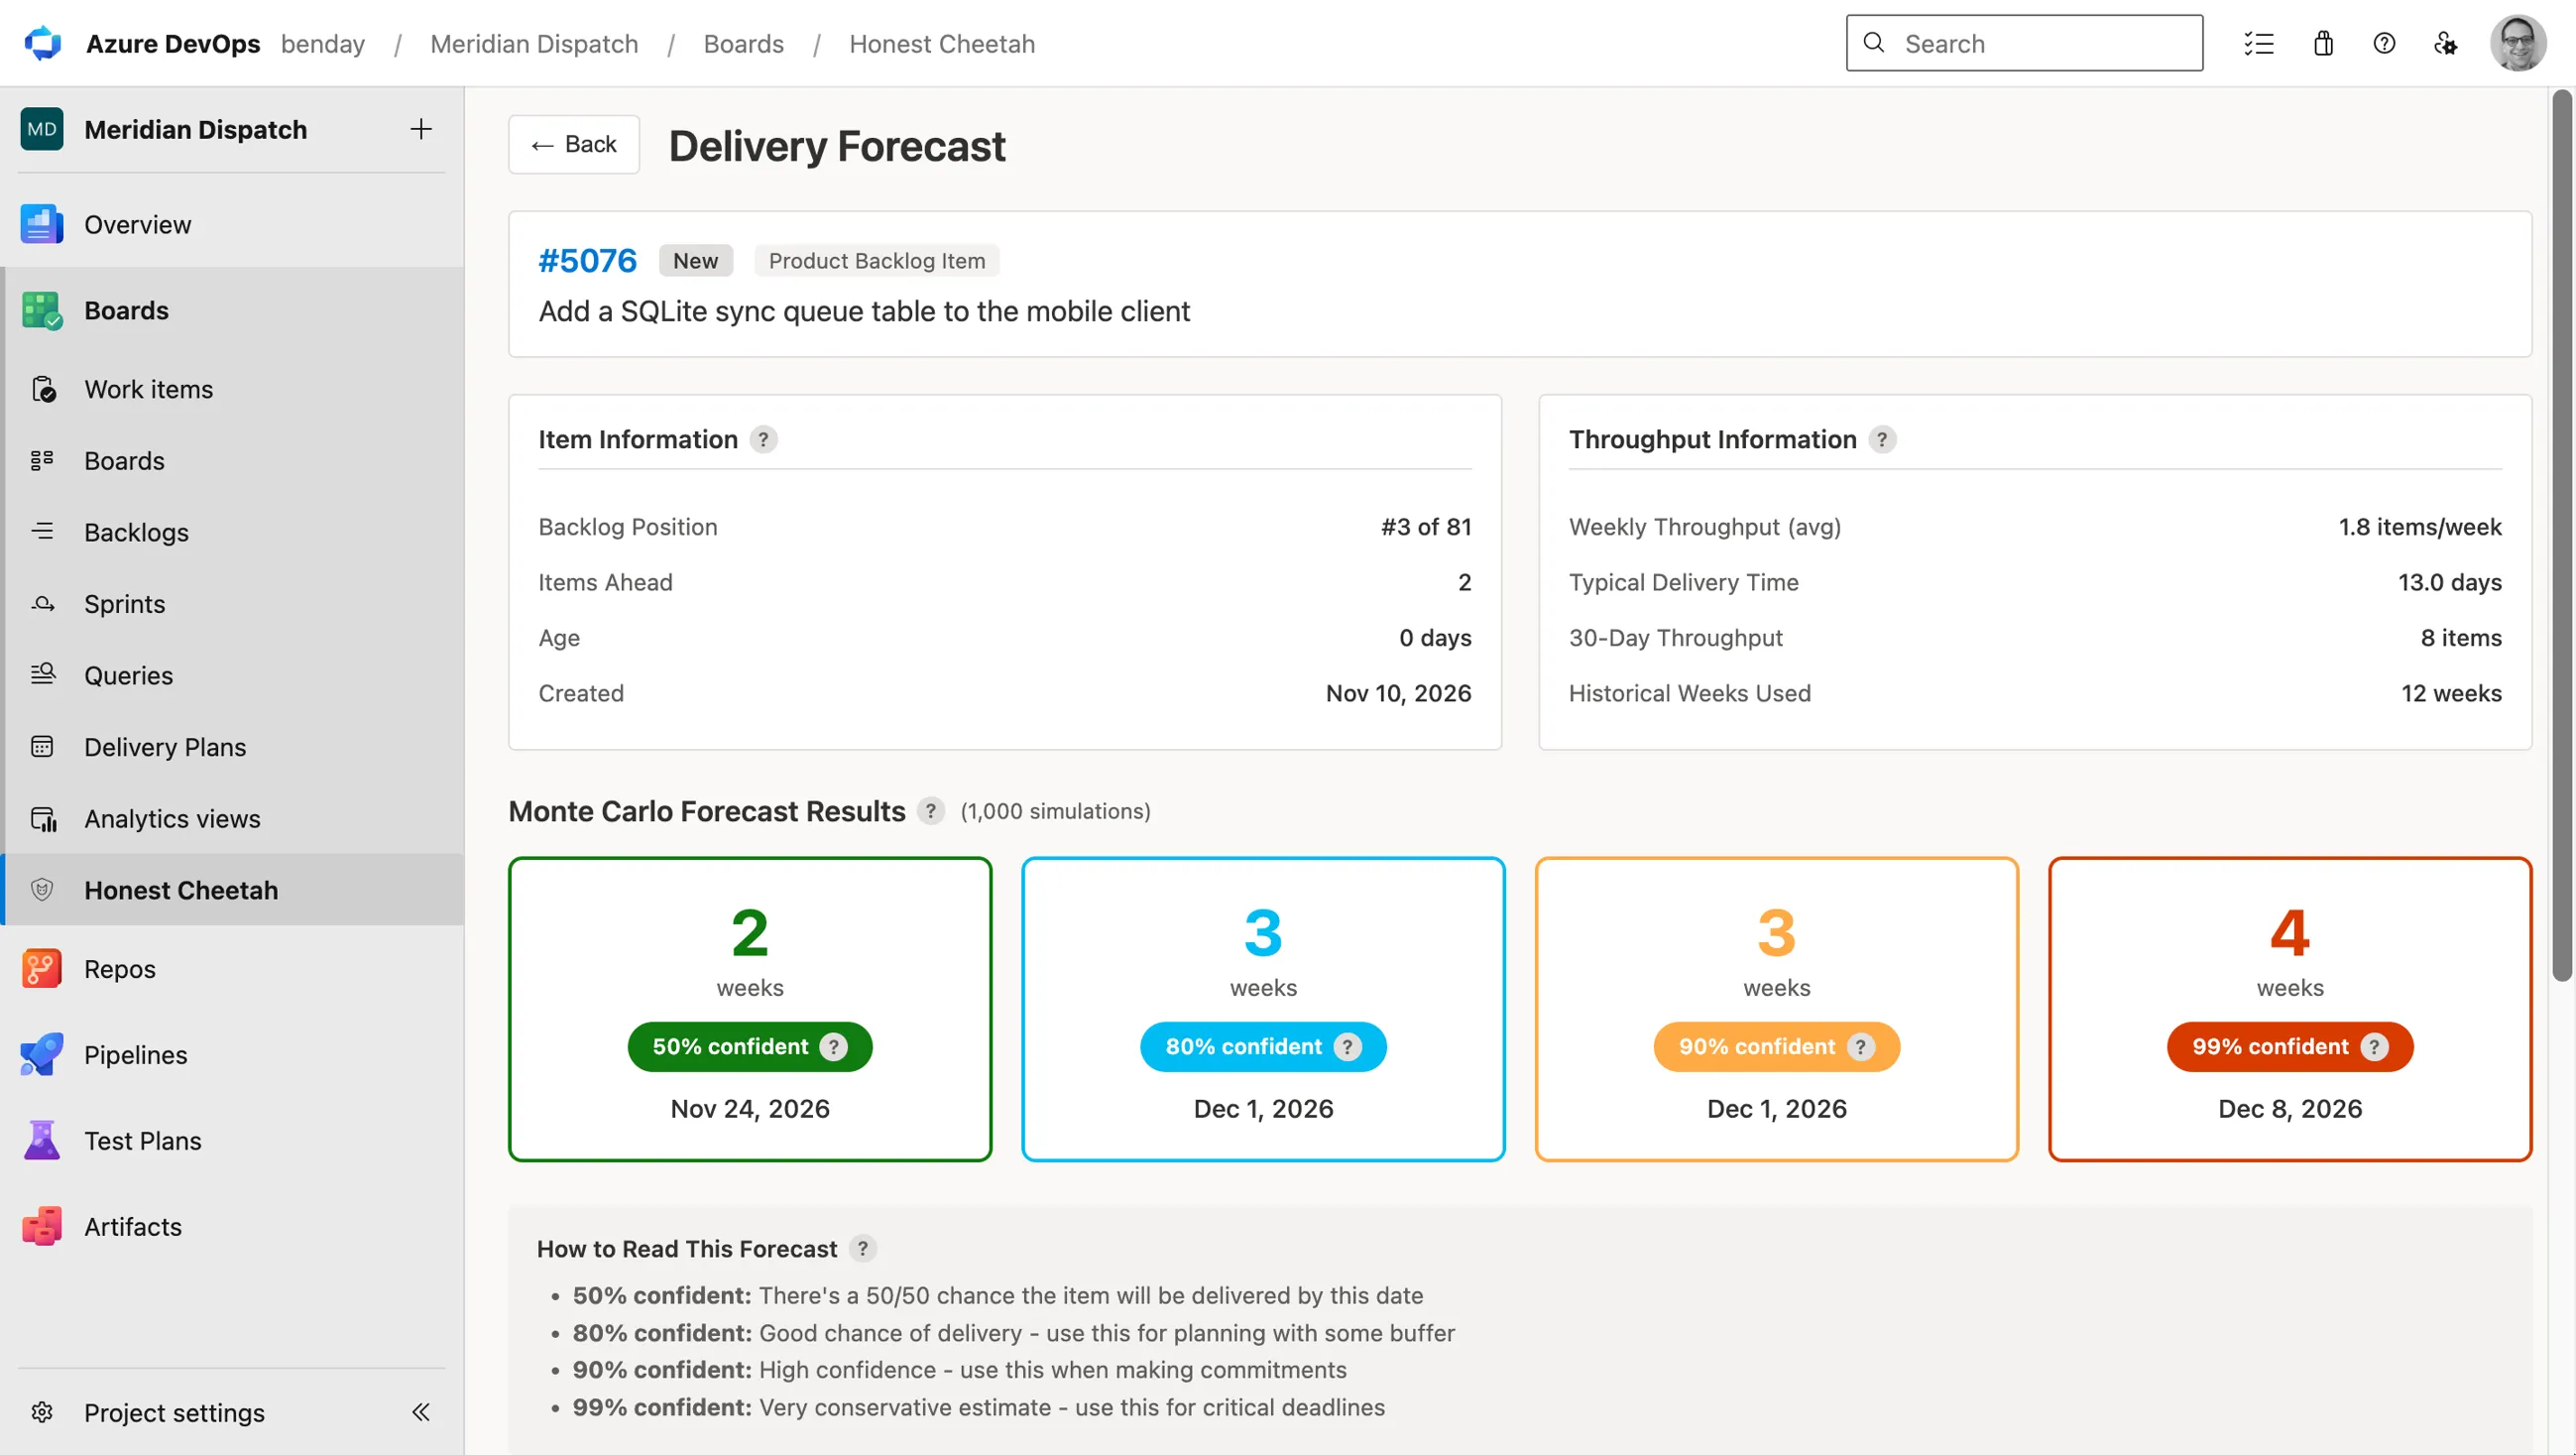
Every item on the backlog has a Forecast button. It answers for that item, given where it sits in the backlog and how fast the team has been going. Reorder the backlog and the answer changes, which is the point.
Showing zeros?
The extension reads your process configuration to work out which work item types are requirements and which states mean "started" and "finished." The out-of-the-box process templates just work. If you've customized your process and the extension shows 0 and N/A everywhere, the backlog levels or state categories need a look: here's the fix.
Install it
- Open the Visual Studio Marketplace listing and click Get it free.
- Choose the Azure DevOps organization to install it into. You'll need to be a Project Collection Administrator, or ask one to approve the install.
- Open a project, click Honest Cheetah under Boards, and pick a team from the Team list (or All Teams).
Thinking about GitHub?
The same metrics and forecasting are free on GitHub Projects in Honest Cheetah for GitHub. And if you want to see one of your team projects on a GitHub Projects board, backlog and history included, before deciding anything, the import does that for free.
If the bigger question is the migration itself, that's a different page. If it's TFVC, that one.