If you read this blog from time to time, you know that I do a fair amount with Visual Studio Load Testing. Well, when I’m working with a customer who hosts their apps inside of VMWare, it’s always been a just pain to know what’s *really* going on with processor utilization inside the virtual machine (aka. “inside the guest OS”.)
The issue is that VMWare’s hypervisor does a lot of magic that causes the Windows PerfMon counters for the Processor to be wildly inaccurate inside of the virtual machines.
Every once in a while, I’d search around on the internet(s) for a solution but never came up with anything and I’d pretty much written off knowing the truth about Processor % Utilization in my Visual Studio Load Tests. Well, I got grumpy enough at VMWare today and did another search.
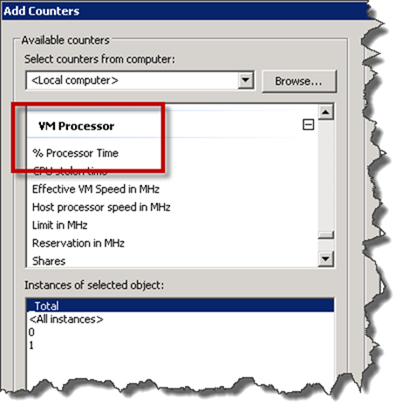
THIS TIME I FOUND AN ANSWER!!! Someone named “Vitaliy S.” in a VMWare Forum thread posted that there’s a Performance Monitor Category called “VM Processor” and “VM Memory”. Finally!
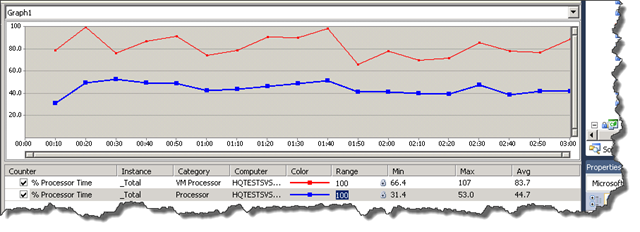
I added the VM Processor “% Processor Time” counter to my load test and graphed it against the standard Windows Processor “% Processor Time”. As you can see from the graph below, there’s a pretty significant difference between the two.
BTW, the sharp-minded readers out there may also notice that VMWare thinks it’s giving this VM 107% processor utilization…so…uhhh…that’s a little weird. Whatever, at least I’ve got some better PerfMon counters for the processor in VMWare.
-Ben


