I’ve been having problems debugging my Silverlight applications lately. Everything ran fine as long as I didn’t hit a breakpoint but -- WHOA NELLIE! -- as soon as I did, I’d have to wait 10+ seconds before I could do anything. And by “anything” I mean, *ANYTHING* on the computer. I couldn’t change windows. I couldn’t stop debugging. I couldn’t open Task Manager to see what was eating my computer. Nothing. Because I of this, I got really good at not using the debugger very much (I think this is a good skill, BTW.) Well, you can’t avoid the debugger all the time and recently my Silverlight debugging problems went from horrible to excruciating.
The Symptoms: Super slow debugging of Silverlight in Visual Studio. Break points get hit and it takes 10’s of seconds for Visual Studio to become usable.
The Problem: One or more Internet Explorer (IE) Add-on.
The Solution: Experimentally disable/enable individual IE Add-ons in order to figure out which one is causing the problem.
Step 1: Open Internet Explorer
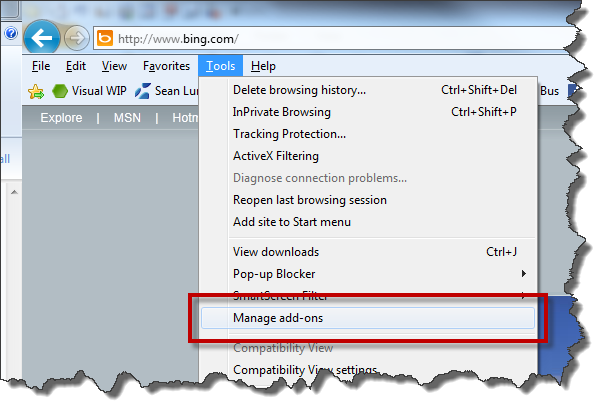
Step 2: Press the ALT key to bring up the main menu
Step 3: Go to the Tools menu and choose Manage Add-ons
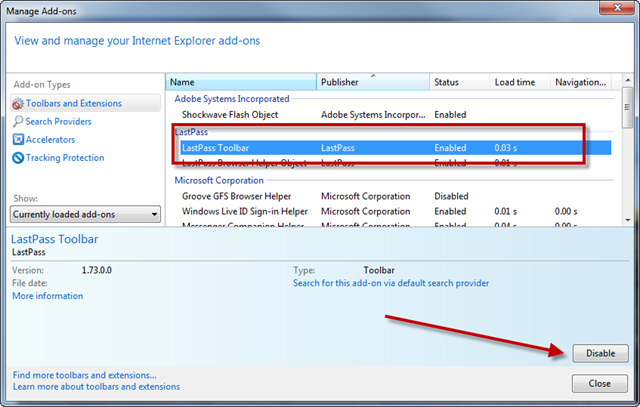
Step 4: On the Manage Add-ons dialog, choose the add-on that you suspect is causing the problem, and click the Disable button and then click the Close button
Step 5: Try debugging a Silverlight application with breakpoints.
Step 6: If debugging performance doesn’t improve, re-enable the breakpoint from Step 4 and repeat the disable process for a different add-on.
Hopefully, this solves your problem.
-Ben
-- Looking for help with your Silverlight or Windows Phone 7 application architecture? Has testing your Silverlight application got you down? Drop us a line at info@benday.com.


