In Team Foundation Server 2005 and Team Foundation Server 2008, one of the best ways to break the out-of-the-box Team Project reports is to add new status values for your work items. Unfortunately, adding new work item status values is one of the first things that most customers need to do. For example, I always add an initial status of "Proposed" for my Task and Bug work items in my MSF for Agile Team Projects. This allows me to add work items to my project without having to decide if I'm actually going to do them. This might seem like a slightly weird idea -- if I don't know if I want to do something then why should I put it in TFS at all? -- but this allows me to "brain dump" into TFS and gives me a place to track all the things I think I MIGHT have to or want to do in the future on my project. This brain dump frees me up from having to actively remember stuff and lets me worry about actually doing my job rather than trying to be some memorization expert.
This blog post will walk you through the process of modifying the Remaining Work report in an MSF for Agile v4.2 Team Project. This is a slightly modified version of a lab in my 5-day Visual Studio Team System & Team Foundation Server class. If you're looking for help installing or configuring Team Foundation Server or want guidance on using and adopting Visual Studio Team System, please contact me via http://www.benday.com.
Pre-requisites:
- You have already exported the MSF for Agile 4.2 Process Template to your local disk at C:labsMSF for Agile Software Development – v4.2.
- You have installed the Business Intelligence Design Studio (BIDS) 2005 from the SQL Server 2005 installer disk and applied any relevant service packs. Currently, there is no Visual Studio 2008 equivalent of BIDS and therefore this lab requires you to use some Visual Studio 2005 tools.
- You have customized at least one of the work items in your Team Project to introduce a “Proposed” work item state value (System.State).
The completed version of this lab is available for download from here.
To begin, open up Visual Studio 2005 and create a new project.
- Choose: Report Server Project
- Name: TfsReportCustomization.Reports
- Location: c:labs
- Solution Name: TfsReportCustomization
- Click: OK
In Solution Explorer you should now see your new project.
Now, we’ll import the report definition files from the exported MSF for Agile process template.
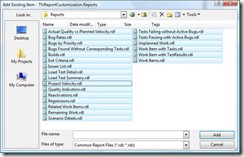
- In Solution Explorer, right-click the Reports folder | Add… | Existing Item…
- In the Add Existing Item dialog, navigate to:
C:labsMSF for Agile Software Development - v4.2Reports
- Select: All .rdl files
- Click: Add
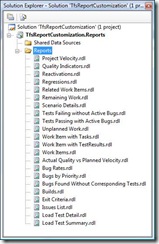
In the Solution Explorer, you should now see all the files you just added to the project.
The TFS reports reference two Shared Data Sources: TfsReportDS and TfsOlapReportDS. In order to make these reports run in Visual Studio, we’ll need to re-create these data sources.
- In Solution Explorer, right-click the Shared Data Sources folder | Add New Data Source
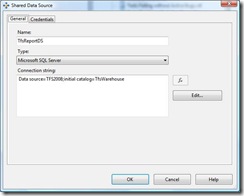
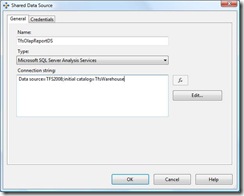
You should now be on the Shared Data Source dialog.
- Name: TfsReportDS
- Type: Microsoft SQL Server
- Connection string: Data source=TFS2008;initial catalog=TfsWarehouse
NOTE: you should replace “TFS2008” with the name of your Team Foundation Server data tier in the connection string. You may also have to provide the appropriate credentials on the Credentials tab of the Shared Data Source dialog.
- Click: OK
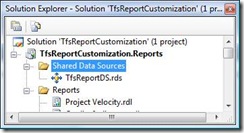
The new TfsReportDS data source should now be visible in the TfsReportCustomization.Reports project as “TfsReportDS.rds”.
Now, let’s repeat this process and create the Shared Data Source for the reporting OLAP connection.
- In Solution Explorer, right-click the Shared Data Sources folder | Add New Data Source
- Name: TfsOlapReportDS
- Type: Microsoft SQL Server Analysis Services
- Connection string: Data source=TFS2008;initial catalog=TfsWarehouse
NOTE: you should replace “TFS2008” with the name of your Team Foundation Server data tier in the connection string. You may also have to provide the appropriate credentials on the Credentials tab of the Shared Data Source dialog.
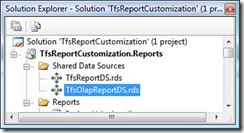
You should now see the TfsOlapReportDS.rds in the Shared Data Sources folder.
Now let’s begin editing the Remaining Work report.
- In Solution Explorer, double-click “Remaining Work.rdl”
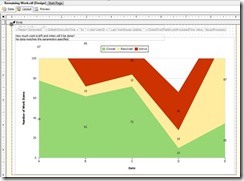
You should now see the Layout tab of the Remaining Work report and the development view of the report. Notice that at the top of the report only the Closed, Resolved, and Active status values are shown.
Best practice: Before you start customizing the report, you should add this project to source control and check in your code. This will give you a baseline version that you can roll back to if you make mistakes.
Ok. Now is when we’ll start adding support for our additional status values. First, we’ll modify the parameters for the dsWorkItemHistory dataset.
- Click the “Data” tab
- Dataset: dsWorkItemHistory
- Click the “…” button
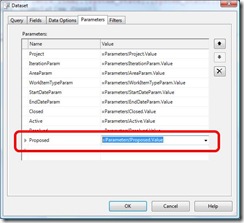
You should now see the Dataset dialog.
- Click the “Parameters” tab
- Add a new parameter to the bottom of the list
o Name: Proposed
o Value: =Parameters!Proposed.Value
- Click: OK
You should now see the dataset query window for dsWorkItemHistory again. Let’s modify the query to pull back the count of Proposed work items.
Locate the following section of the query.
MEMBER [Measures].[Resolved Cumulative Count] AS
Sum(
(StrToMember("[Work Item].[System_State].[System_State].[" + @Resolved + "]")),
[Measures].[Cumulative Count]
)
SELECT
{
[Measures].[Date Value],
[Measures].[Active Cumulative Count],
[Measures].[Closed Cumulative Count],
[Measures].[Resolved Cumulative Count]
} ON COLUMNS,
Now we’ll add the code to bring back the proposed work item count.
MEMBER [Measures].[Resolved Cumulative Count] AS
Sum(
(StrToMember("[Work Item].[System_State].[System_State].[" + @Resolved + "]")),
[Measures].[Cumulative Count]
)
MEMBER [Measures].[Proposed Cumulative Count] AS
Sum(
(StrToMember("[Work Item].[System_State].[System_State].[" + @Proposed + "]")),
[Measures].[Cumulative Count]
)
SELECT
{
[Measures].[Date Value],
[Measures].[Active Cumulative Count],
[Measures].[Closed Cumulative Count],
[Measures].[Resolved Cumulative Count],
[Measures].[Proposed Cumulative Count]} ON COLUMNS,
- Add the highlighted code as shown above
Now we have to modify the query parameters.
- Click the “Query Parameters” button (circled above)
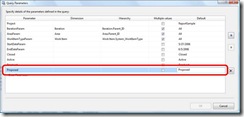
You should now be on the Query Parameters dialog. We’ll now add the Proposed value to the bottom of the list.
- In the Parameter column, click “
- In the Parameter column, type: Proposed
- In the Default column, type: Proposed
- Tab off of the newly added row to activate the “OK” button
- Click: OK
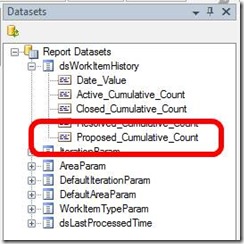
The dsWorkItemHistory dataset configuration changes are now complete. In the “Datasets” window (probably in the left pane), you should now see a field named “Proposed_Cumulative_Count”.
- Go to the Datasets pane
- Expand: dsWorkItemHistory
- Verify that “Proposed_Cumulative_Count” is in the list.
If “Proposed_Cumulative_Count” is not in the list, go back and check the “SELECT” portion of the query.
We’ll now start editing the display of the query to use the Proposed count.
- Click on the “Layout” tab
This next part is a little bit tricky. We need to drag the Proposed_Cumulative_Count field from the Datasets window and drop it in a field on the Layout designer that’s hidden until we hover over it. Making this next step work might take a little bit of trial and error.
- In the Datasets window, click and drag the “Proposed_Cumulative_Count” as shown in the diagram above to point #2
- Pause briefly at point #2 to make the data fields list appear
- Continue dragging the Proposed_Cumulative_Count to point #3 and drop it onto the words “Drop data fields here”
If you were successful, you should now see the Proposed Cumulative Count in both the data fields box and in the chart’s legend.
In order to fix the chart’s legend so that it says “Proposed” instead of “Proposed Cumulative Count”, we’ll need to edit the properties for the chart field.
- In the data fields box, right-click: Proposed Cumulative Count | Properties
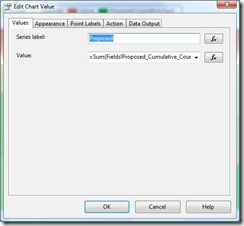
You should now be on the Edit Chart Value dialog.
- Series label: Proposed
- Click: OK
On the chart layout, you should now see the legend with the value of “Proposed” instead of “Proposed Cumulative Count”.
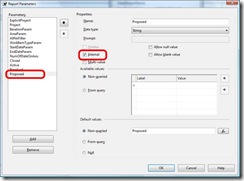
Only a little bit more to do. We need to make a tiny tweek to one of the report parameters.
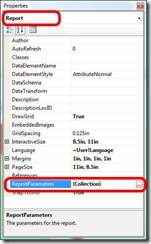
- Go to the Properties window for the report
- From the drop-down, choose: Report
- Click: ReportParameters
- Click: “…”
Clicking “…” should have brought up the Report Parameters dialog.
- In the Parameters listbox, choose: Proposed
- Locate the “Internal” checkbox
- Check: Internal
- Click: OK
Now let’s see if we made the edits correctly.
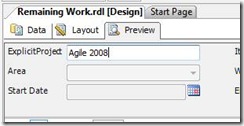
- Click the “Preview” tab
- Set the “ExplicitProject” value to be the name of your team project (example: Agile 2008)
The ExplicitProject field is only visible at development time and is used to say which Team Project you want to query for. During production, this value is retrieved at runtime by looking at the name of the folder that the .rdl file is running from.
- Tab off of the ExplicitProject field.
Moving away from the ExplicitProject field causes the rest of the report execution fields to populate with values. (NOTE: the values you see may not be the same as what is in the image below.)
- Set the start and end date values to a time range that has data
- Click: View Report
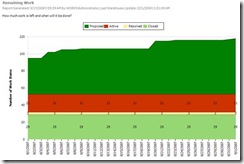
You should now see your populated Remaining Work report with values for Proposed work items.
The report customization is finished. If you’re developing under source control, you should check in your changes.
Alright. So we’ve got the report customized. Let’s publish it back to our TFS report server we can actually use it.
- Open Internet Explorer
- Navigate to: http://your_tfs_name/Reports
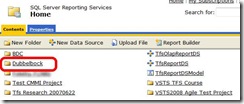
You should now be on the SQL Server Reporting Services home page and you should see a list of your available Team Project folders.
- Click on the folder for the Team Project you’re customizing. (example: Agile 2008)
Clicking the project link will take you a list of Reports for that project.
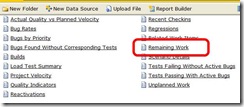
- Locate the “Remaining Work” report
- Click: Remaining Work
You’ll now be taken in to the Remaining Work page.
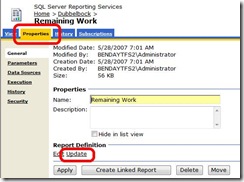
- Click the “Properties” tab
You should now see the Remaining Work report’s properties page.
- Locate the “Update” link
- Click: “Update”
You should now be on the “Import Report” page for Remaining Work.
- Click: Browse…
- Choose the Remaining Work.rdl file on your local disk. If you set up your code as described at the start of this lab, the path should be
C:labsTfsReportCustomizationTfsReportCustomization.ReportsRemaining Work.rdl
- Click: OK
You should be on the Properties screen again.
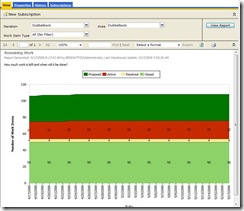
- Click the “View” tab
You should now see your updated Remaining Work report with the Proposed value displayed in the chart.
You’ve completed the customization of the Remaining Work report.
If you're looking for help installing or configuring Team Foundation Server or want guidance on using and adopting Visual Studio Team System, please contact me via http://www.benday.com.


